
How exactly Google ranks websites is a well-kept secret. However, it does provide us with few tools to improve the website’s performance.
These tools help us to see our website through Google’s eyes and improve them to provide the best user experience possible.
One such tool is Lighthouse that calculates an overall score for your website to see how it performs on mobile and desktop devices.
Introduction to PageSpeed Insights and Lighthouse
What is Google PageSpeed Insights?
PageSpeed Insights (PSI) reports on the website’s performance on mobile and desktop devices. It uses Lighthouse to collect and analyze lab data about the page. It also collects real-world data to provide suggestions on how the performance of the page may be improved.
What is Google Lighthouse?
Unlike PageSpeed Insights, Google Lighthouse only collects lab data under consistent conditions to calculate a performance score for the website. It also provides other scores like SEO performance, accessibility, PWA and other best practices.
Why are Google Lighthouse and PSI scores important?
Google has started to focus more on on-page user experience. They have even added a new set of Core Web Vitals. These scores help website owners get an idea of the experience that visitors have on their website. These tools also provide suggestions on exactly what developers can work on to improve the page experience.
How are these scores calculated?
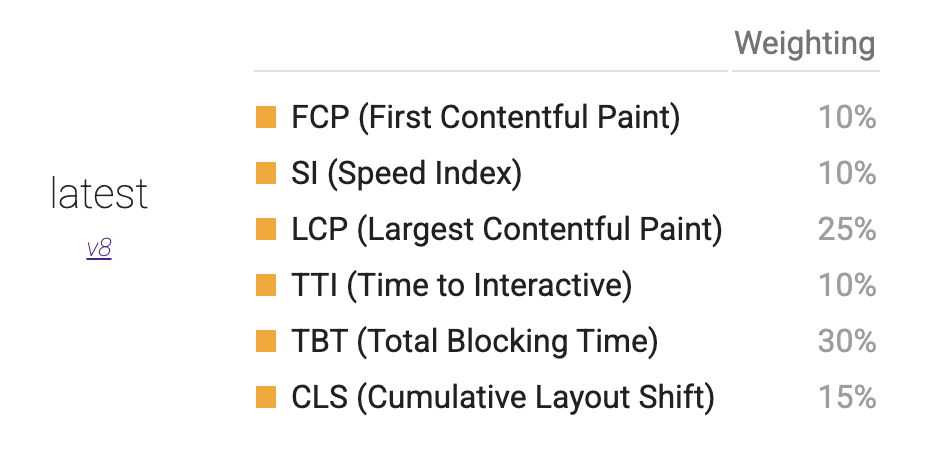
Google’s latest version of the lighthouse (v8) calculates the performance score by taking a weighted average of 6 metrics or web vitals. These are:
- First Contentful Paint (FCP)
- Speed Index (SI)
- Largest Contentful Paint (LCP)
- Time to Interactive (TTI)
- Total Blocking Time (TBT)
- Cumulative Layout Shift (CLS)
Out of these 6 metrics, 3 of them form the core web vitals and thus, are given more weightage in comparison to others. These 3 metrics are: Largest Contentful Paint (LCP), Cumulative Layout Shift (CLS) and Total Blocking Time (TBT).
Note: Lighthouse measures Total Blocking Time (TBT) instead of First Input Delay (FID), since lighthouse operates in a lab environment where there is no user input. TBT forms an excellent proxy for FID.
Issues with the Lighthouse and PageSpeed Insights Tool
These free tools by Google are amazing but they don’t allow website owners to check the performance of multiple URLs at once.
Another drawback of using these tools is that you have to manually input the URLs every time you want to get a performance score for the web page.
I’ve created a Google Sheets Script that automates the process of getting Lighthouse Performance Score, SEO, PWA, Accessibility and other Best Practices scores for multiple URLs.
You can even be notified every time the program runs.
There’s a short set-up process that you have to follow initially post which you don’t need to do anything. Just come back to the sheet to see if everything is running smoothly and identify areas on your website that needs improvement.
How to Set Up the FREE Google PageSpeed Insights Monitor?
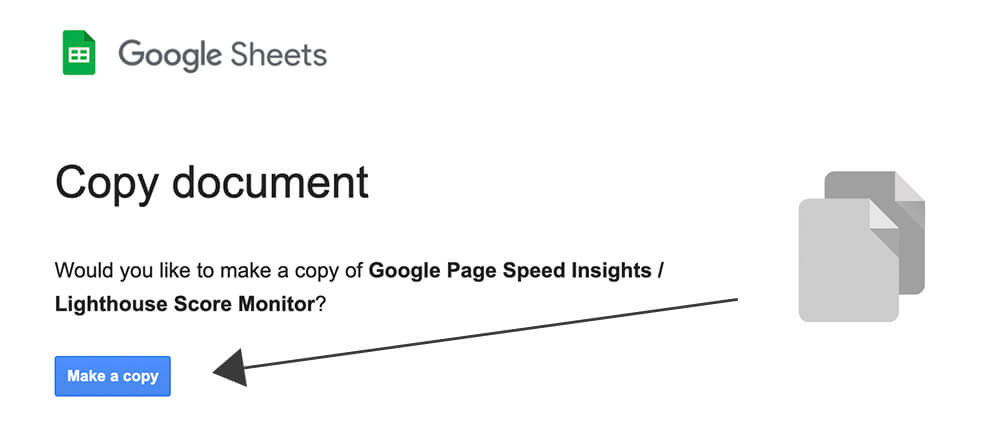
1. Make a Google Sheet Copy
The first step would be to make a copy of the Google PageSpeed Insights Monitor Google Sheet.
You might be asked to log in using your Gmail Account. Once you’ve done that, click on make a copy.
2. Get PageSpeed Insights API
It’s free to get one and depending on your usage, you might not have to pay for it ever. Just follow the following steps to get your API key.
How to Get PageSpeed Insights API
Total Time: 5 minutes
Log in to Google Cloud Platform
Visit https://code.google.com/apis/console, log in with your Google Account and accept the terms and conditions.
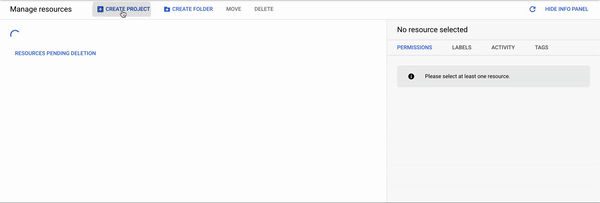
Create Project
Click on Create Project, give your project a name and click on create. Once the project is created, click on the select project button.
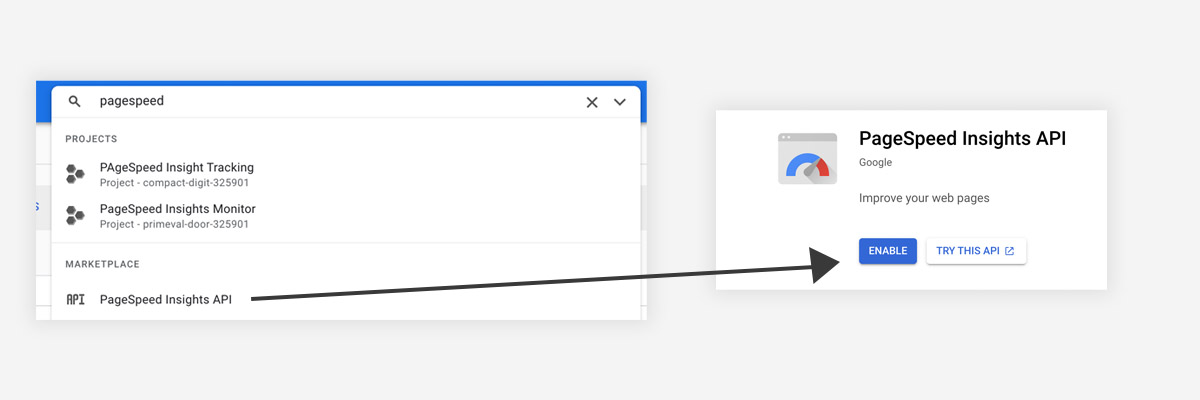
Enable PageSpeed API
In the search bar on top, type PageSpeed API and click on the API option under Marketplace. Once the API page opens click on enable.
Create Credentials
Once you’ve enabled the API, you’ll have to create credentials to be able to use the API.
From the hamburger icon on the top left, select APIs and services and then credentials.
Click on create credentials -> API Key
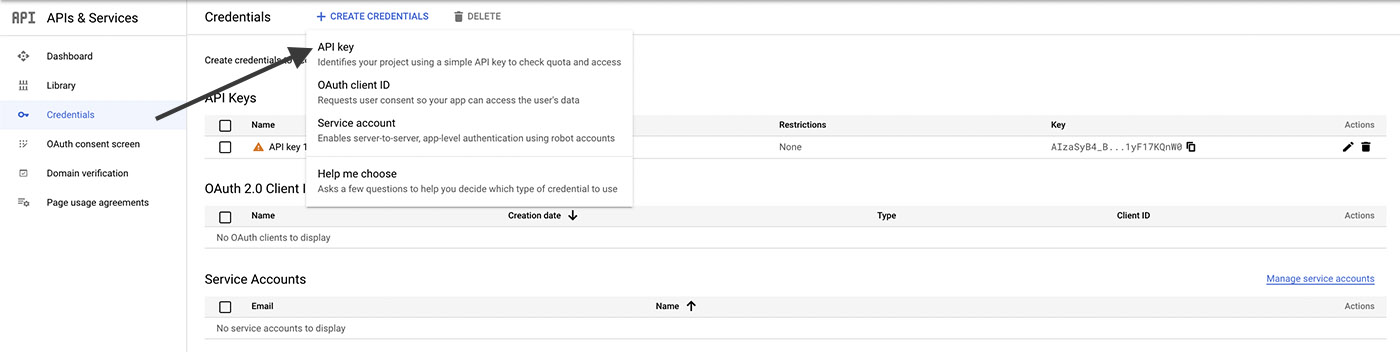
Copy the API Key
Click on the copy icon next to the API key to copy it.
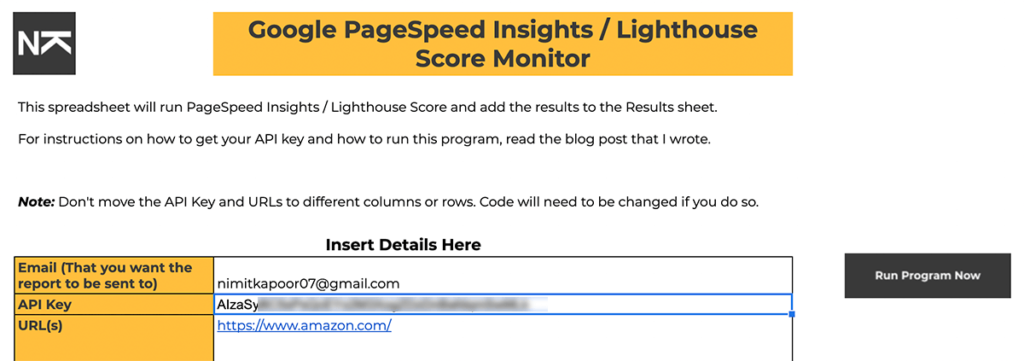
3. Fill in the details in the “Info” sheet of the workbook
In the Info sheet, paste the API key next to the API key cell. Put in the email address you want the report to be sent to and the URL(s) that you want to measure.
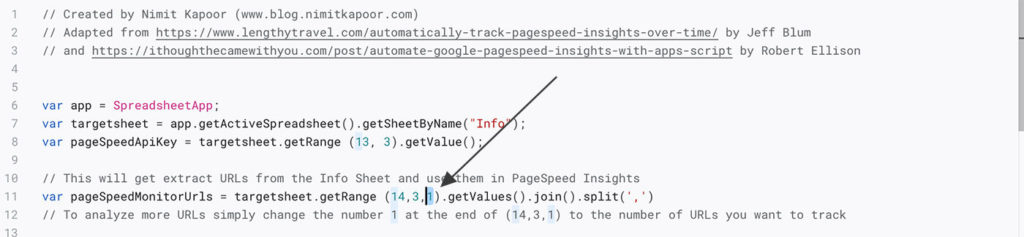
3.1 Multiple URLs
If you want to analyse only one URL, skip this step. If you want the scores of multiple URLs, a slight change in the script is needed.
In the top menu bar, click on tools -> script editor.
In line 11 of the code, change the number 1 in (14,3,1) to the number of URLs that you want to track. And click on the Save button.
4. Run the Program
When you’re running the program for the first time, you’ll have to give proper permissions. To do so, go to tools -> script editor from the top menu.
When the script editor opens, click on Run and then give all the needed permissions.
If the program runs successfully, you’ll notice a new row in the results sheet with the Lighthouse values.
5. Set a daily trigger
If you want the program to run in the background daily or once a week, you’ll have to enable a trigger. It’s very straightforward.
Go to Tools -> Script Editor
Select clock icon on the left menu -> Add Trigger -> Change event source to Time-Driven -> Set Select type of time-based trigger to Day Timer
And click save and now the Google PageSpeed Insights Monitor will run every day in the background. You just have to check the report when you want. Nothing else is needed.
Analysis
The cells of the sheet have been colour coded to indicate the level of performance. Cells with a red fill indicate a need for improvement. Yellow indicates moderate performance that can also use some minor updates. Green cells are areas that are performing well and don’t need any further action.
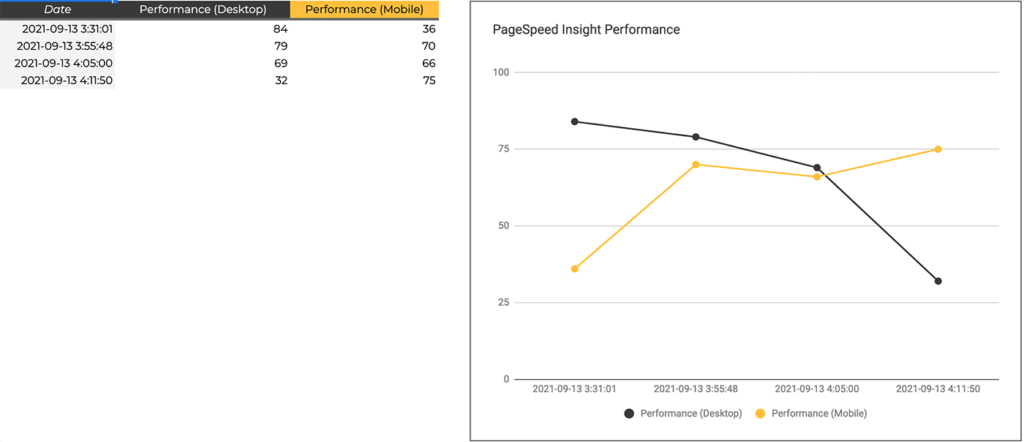
Let the program run for a few days and you’ll see the graph in the performance scores and charts sheet get filled with data points. This visualisation helps you to easily interpret the overall performance of the website over time.
Note: If you’ve put multiple URLs, make sure you filter the URLs and see only one URL at a time in the chart. To set the filter, just use the slicer above the table to filter out the URLs.
Conclusion
Page Experience is one of the signals that Google considers when generating Search results. A focus on the core web vitals is extremely important to deliver an exceptional page experience to users.
Thus, monitoring the page performance regularly and implementing any needed improvements can increase the SERP rankings and conversion rates tremendously.
With just a little bit of setting-up effort, this free tool can help you rank your website higher on the search engines.
Apart from PageSpeed, you should also consider On-Page SEO and Off-Page SEO to improve your website rankings.

5 Responses
Took me ages to search through this page to find the link to the google sheets file!! Needs to be higher up please!
Hey – thanks for this , really useful! I had a look at this and saw a way to improve the single or multiple URL issue. If you count the number of URL’s in a range with “counta”, which will provide an integer value of how many of the cells have been populated, then you can grab this in app script by adding a new variable:
var numberOfUrls = targetsheet.getRange (16, 2).getValue();
And then change the line with the instruction to get the URL range, by adding the variable in place of the ‘1’:
var pageSpeedMonitorUrls = targetsheet.getRange (14,3,numberOfUrls).getValues().join().split(‘,’)
Then the tool will work for any number of URLs placed into the info sheet! Hope that helps.
Hey thanks a lot for this! Will be updating the sheet soon.
Is there a way to tackle 15-20 urls without getting a “Exceeded maximum execution time” timeout ?
Hey Daniel,
Unfortunately, there is no way around the timeout restriction. Before Google had a 30-minute timeout limit for workspace accounts but they rolled it back to 6 minutes.
I’ll have to spend some time thinking of a way to skip URLs that have already been done for the same day when you run the script again. Will start working on it soon.
I’ll email you when I’ve updated the sheet to cater to the execution time limitation.