As an SEO, you’ll end up working with a lot of tools like Google Search Console, Google Analytics, Ahrefs, Semrush etc. These tools are great but often you’ll find that navigating between these tools to find useful insights becomes very time-consuming.
For an in-depth keyword and search performance analysis, you’ll need some insights or graphs that these tools don’t provide. For instance, Google Search Console is a great tool but the visualisations that it provides are quite limited and it’s not easy to analyse tabular data. It can be a nightmare if you just have to use Search Console for your keyword analysis.
GA4 is trying to solve this problem with its new explorations tool.
For keyword analysis and SEO reporting, I often find GSC to be quite inadequate, so I’ve built this Google Data Studio template.
With this template you’ll be able to analyse:
- The number of organic keywords that your site is ranking for.
- The average position of your website for the selected time period (compared to the previous period).
- The impressions, clicks and click-through rates for your site for the selected time period (compared to the previous period).
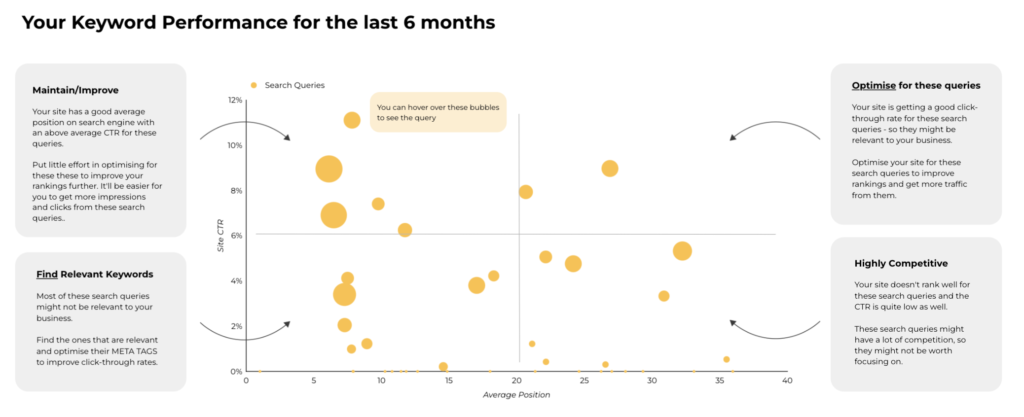
- Keyword performance over the last 6 months – The grid will help you identify the keywords that you should put effort into optimising your site for and the ones that are not worth pursuing.
- The number of keywords that your site has in the Top 10 results, between 10-30 and 30+ results for the selected time period.
- Detailed keyword analysis in tabular format (similar to Google Search Console).
- Keyword cannibalisation and identification of landing pages that are ranking for the same keyword.
Since Google Data Studio does not allow copying of calculations and blended data tables from other reports, you’ll have to perform the following steps to get this as the end result.
Setting up the Keyword Analysis & SEO Report
Step 1: Make a copy of the report
Click on the link below to go to the Keyword Analysis & SEO Data Studio Report.
Make sure you’re logged in with the Gmail account that you use to access Search Console Properties.
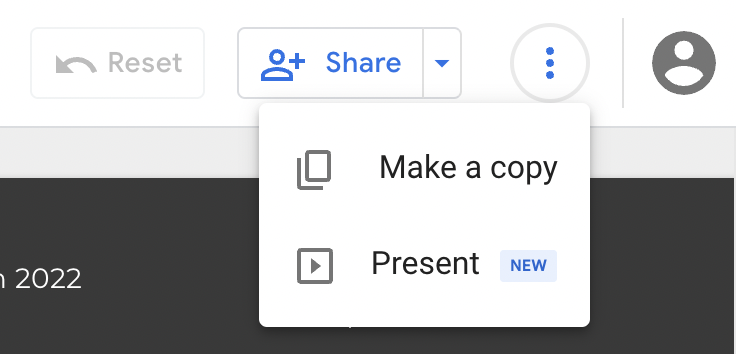
On the top right corner – click on the three dots and select Make a copy.
Step 2: Connect to your Data Source
When you click on Make a copy – you’ll be asked to connect your data sources.
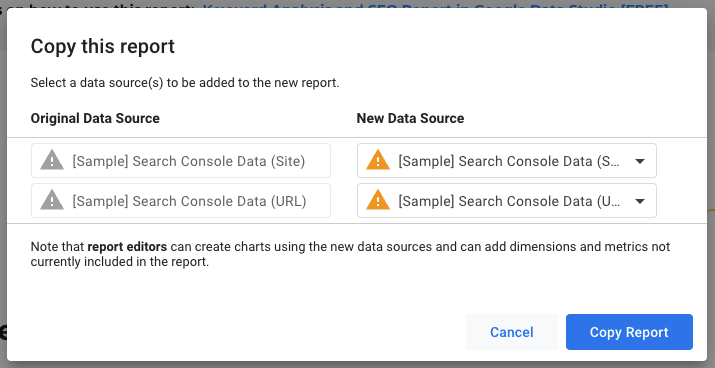
Click on the first source under the New Data Source section and then click on Create data source
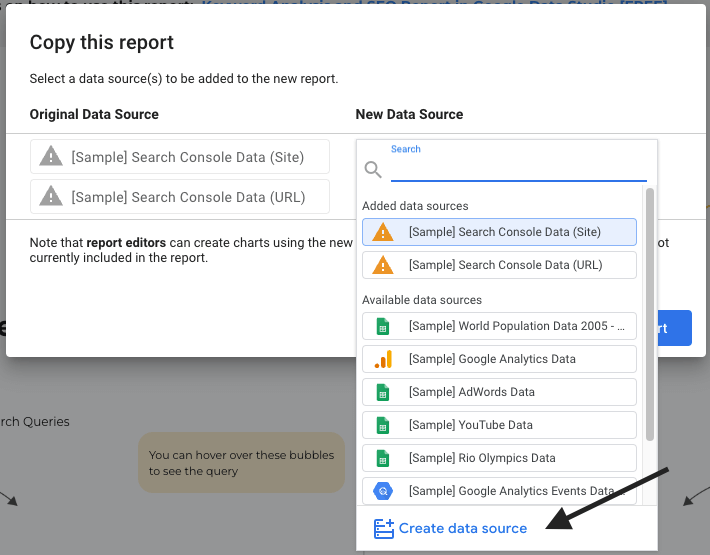
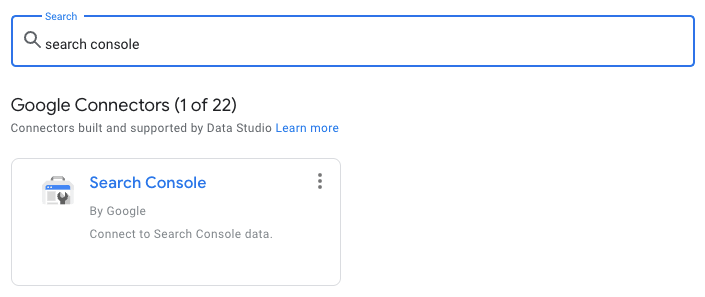
Find the Search Console Data Connector from the list of available data connectors. Once you click on it, you might be asked to authorize the data studio. Click on the Authorize button.
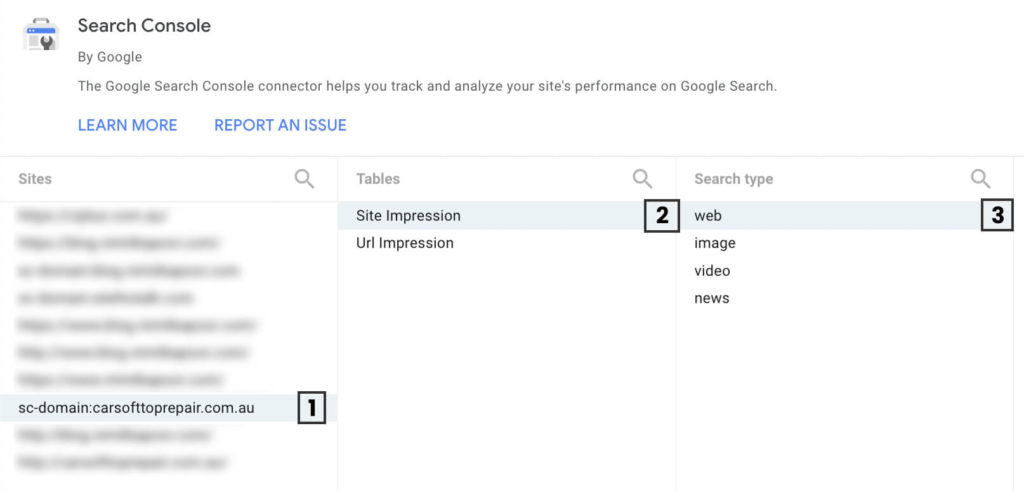
Once you’ve authorized data studio, you’ll be presented with the list of your Search Console properties. Select the property that you want to analyse the data for -> under Tables select Site Impressions -> under Search Types select web -> Then click on Connect in the top right corner.
The table that appears once you click on Connect lists all the Fields that are available in the data source. Just click on Add to Report button in the top right corner.
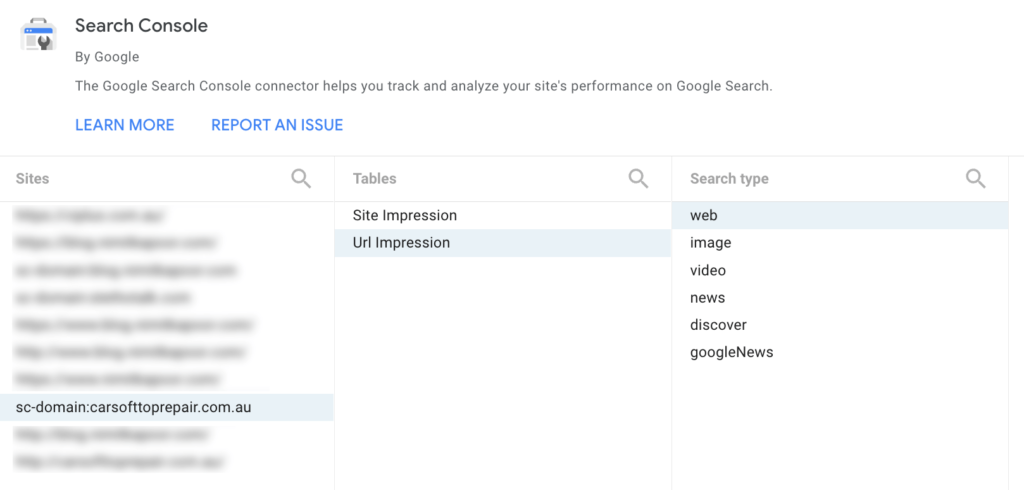
Do the same thing for the second source but this time instead of selecting site impressions under tables select URL Impression.
Once you have added both the data sources to the report, you’ll be able to copy the report.
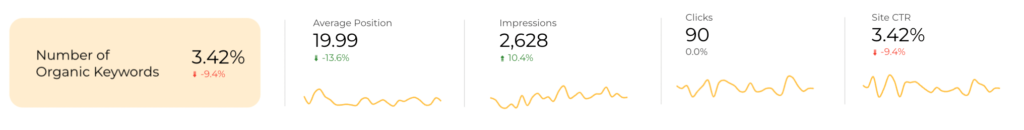
In the report that opens, you should see the following values:
- Number of Organic Keywords (Still needs to be set up)
- Average Position
- Impressions
- Clicks
- Site CTR
- Bubble chart for the keyword performance for the last 6 months.
- Detailed Analysis Table
There will be certain values where you see errors, such as Keywords in Top 10, between 10-30 and 30+ positions.
Don’t worry as these graphs need to be set up.
Step 3: Calculating the Number of Organic Keywords
This one is super easy to fix. When you copy the report, this scorecard might show a Site CTR percentage there.
To fix this, just select the Value, then on the right under Metric, click on Site CTR and change it to Query.
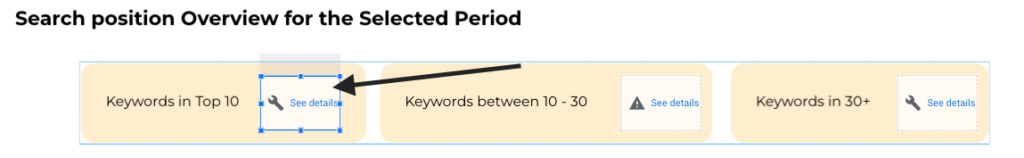
Step 4: Calculating Search Position Overview for the Selected Period
Step 4.1: Add New Fields for Keywords in Top X Rankings
In the Data menu (On the right of your screen) select your data source and then click on Add a field.
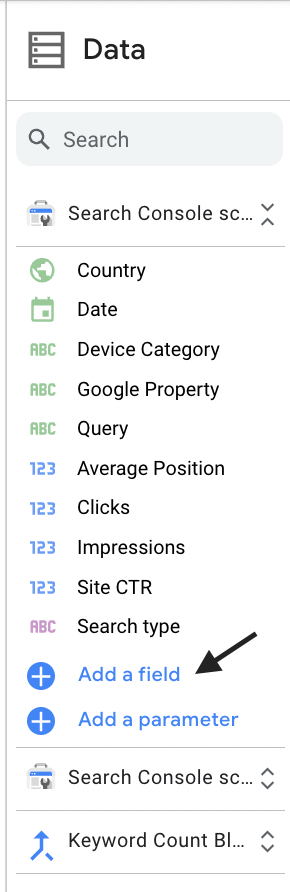
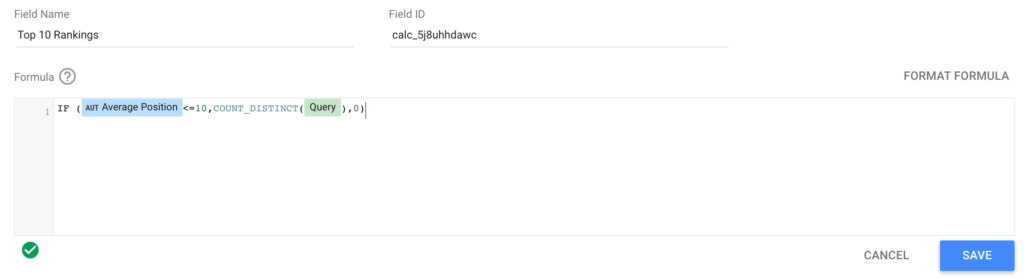
Give the field the name “Top 10 Rankings” and in the Formula section, enter the following formula –
If(Average Position<=10, COUNT_DISTINCT(Query),0)
It should look something like this:
Repeat this step and create two new fields, inputting the following formulae –
Field 2
Name – Top 30 Rankings
Formula – If(Average Position<=30, COUNT_DISTINCT(Query),0)
Field 3
Name – 30+ Rankings
Formula – If(Average Position>30, COUNT_DISTINCT(Query),0)
Step 4.2: Blend Data Source with Same Data Source
To complete your keyword analysis, there’s still some work to be done. It’s not going to come that easy. But trust me, once you’re done with this, it’ll keep recording data and you won’t have to change it again.
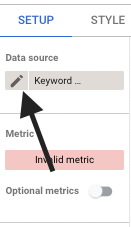
Select the value by clicking on it. Right now, it should show “See Details” since we haven’t set it up yet.
In the Chart Setup section on the right-hand side, click on the pencil icon under Data Source.
Once you click the pencil icon, you’ll see a Blend Data window like the one below.
Just remove all the invalid dimensions and drag the newly created fields – “Top 10 Rankings, Top 30 Rankings and 30+ Rankings” under metric and click on save.
Step 4.3: Get Values for the Search Positions
Once you’ve blended the data source, you’re now ready to start populating the search position cards for keyword analysis.
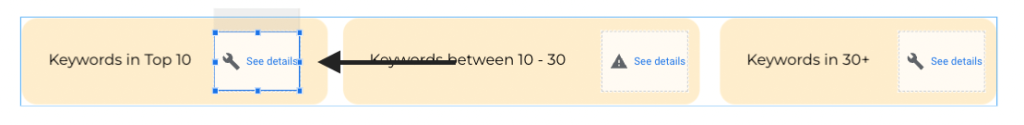
Click on the “See Details” for the Keywords in Top 10.
Under Chart Setup on the right, click on Invalid Metric and then select Top 10 Rankings.
Do the same thing for Keywords in 30+. Click on “See Details” – then under chart setup, click on the Invalid Metric and then select 30+ Rankings.
For Keywords between 10-30 rankings, you’ll have to do something slightly different.
Click on “See Details” for Keywords between 10-30. Then under the chart setup, click on “SUM” in the metric pill and enter the following formula:
Top 30 Rankings – Top 10 Rankings
To confirm if you’ve done this correctly, just add these three values and the sum should be equal to the total number of organic keywords that we calculated in Step 2.
Step 5: Analysing Keyword Cannibalisation
This one is easy to do.
Under the Data Window on the right, click on Add Field for the data source where you have URL Data – to identify which one it is, try to look for the landing page dimension.
Give the Field Name – # of Landing Pages and enter the following formula:
COUNT_DISTINCT(Landing Page)
Select the First Table and then change the URL CTR metric to the one that you just created – # of Landing Pages.
You’ll see that the table now reflects how many pages rank for a particular keyword. Click on the Keyword will give you the URLs of the pages as well and you can then take necessary actions to fix Keyword Cannibalisation.
That’s it! Your Keyword Analysis and SEO Report is now ready. Hope you find it useful.