Are you tired of spending hours manually compiling and analysing your SEO data? Are you drowning in spreadsheets and reports, struggling to make sense of it all? Well, fret no more!
By leveraging the Google Data Studio SEO template (or Looker Studio SEO template), you can create comprehensive and visually appealing SEO reports.
So, let’s dive in and discover how to set up your SEO dashboard in Google Data Studio to streamline your reporting process and unlock valuable insights for your website’s success.
Before we delve into the setup process, let’s take a sneak peek at how the report will appear once the setup is finished.
💡 The Keyword Distribution report has been updated since the above screen recording was done. The update was made to solve a duplication error while counting keywords in different ranking buckets.
This Google Data Studio SEO report template has 7 sections and 12 reports:
- Search Performance
- Overview Report: This report offers a comprehensive view of a website’s performance, showcasing key metrics such as Impressions, Clicks, Average CTR, and Average Position. Additionally, it provides insights into the trends and fluctuations of these metrics over a selected time period, enabling effective monitoring and analysis of the website’s visibility and engagement.
- Keyword Distribution Report: This report provides a comprehensive analysis of a website’s keyword distribution across four categories. It presents the number of keywords that fall within the top 10 positions, 11-20 positions, 21-50 positions, and those ranking beyond 50 in Google SERP. This report offers valuable insights into the website’s keyword performance and visibility across different ranking buckets.
- Content Performance
- Top Content (Top Keywords and Top Pages): This report provides an overview of a website’s performance by showcasing the top keywords and pages. It offers insights into the website’s visibility and engagement based on key metrics such as impressions, clicks, click-through rate (CTR), and average position.
- Branded vs Non-Branded Keyword Performance: The report highlights a website’s visibility and engagement metrics specifically for branded and non-branded keywords. It provides insights into the performance and impact of these two distinct keyword categories, allowing for a better understanding of the website’s reach and effectiveness across different search intents.
- SEO Reports
- Google Algorithm Updates & Custom Events Report: This report evaluates the influence of Google algorithm updates and custom events, such as website redesign, on a website’s performance in search engine results pages (SERPs). It provides insights into the fluctuations and trends in rankings, visibility, and organic traffic, helping to gauge the impact of these factors on the website’s overall search performance.
- Striking Distance Report (Treemap and Table View): The report showcases the number of keywords within striking distance (positions 11-20) and presents quick wins or low-hanging fruit keywords in both treemap and table view formats. It helps identify opportunities for improving search rankings with minimal effort.
- Keyword Cannibalisation Report: The keyword cannibalisation report highlights cases where multiple pages on a website are vying for the same keyword in search engine rankings. It helps identify and resolve conflicts to enhance SEO performance, ensuring that each page targets distinct keywords, thereby optimising overall search visibility and organic traffic.
- Site Engagement Report: The site engagement report provides valuable insights into user engagement by presenting metrics such as average engagement time, total engaged sessions, and total users. It also highlights the top pages based on user engagement and session starts, helping to identify high-performing pages and optimise the user experience on the website.
- Traffic Acquisition & Growth Report: The report offers a comprehensive view of website traffic categorised by country or different channels and sources. It provides insights into the geographical distribution or the origin of traffic, allowing businesses to understand their audience demographics and tailor marketing strategies accordingly.
- Conversion Report: The report displays the total conversions achieved by a website within a specific time frame, providing a clear measure of its overall performance. Additionally, it presents a breakdown of the conversions, providing valuable insights.
- PageSpeed Report: The report leverages the CrUX dataset to showcase the core web vitals of a website, offering insights into key performance metrics such as loading, interactivity, and visual stability.
Let’s get started with the setup now.
Step 1: Make a copy of the resources:
You’ll need to make a copy of two things:
- Google Sheet for Algorithm Updates and Custom Events: This sheet controls the visualisation in the Google Algorithm Updates & Custom Events section of this Google Data Studio SEO template. Copy this Google Sheet before you make a copy of the Data Studio template. You can create a copy of the Google sheet by clicking here.
- Google Data Studio SEO Report: This is the Looker Studio template. You can make a copy from here. Once you’re on the page, click on the three dots on the top right and click on Make a copy.
And select the data sources. This step is quite important. Watch the video below to make sure that you’ve connected to the correct data sources (You will be connecting to your own properties).
💡 You’ll need a GA4 property for this report. If you don’t have one, you can read this post to know more about the differences between GA4 and UA and why you should start using GA4.
Step 2: Fix report sections
Once you successfully establish the correct connections to all the data sources, a majority of the reports in this Data Studio SEO report will start functioning right away. However, certain reports will require the creation of custom fields and other adjustments. Unfortunately, Looker Studio (formerly known as Data Studio) does not automatically replicate these adjustments when you use the “Make a copy” function.
I’ll guide you through each report section individually and explain the necessary adjustments you’ll need to make. It’s a one-time setup process, and afterwards, you’ll have access to these reports at any time, allowing you to monitor and track your website’s SEO performance effortlessly.
Step 2.1: Overview Report – SERP Performance
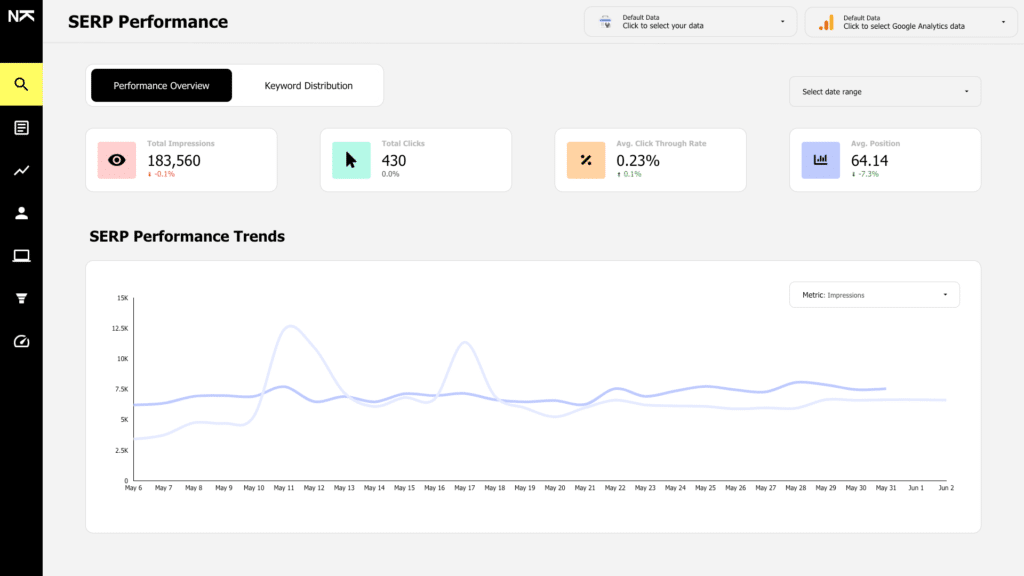
This is the first report section. Most of it will already start showing data. However, you’ll find that one control above the line chart is showing an error.
To fix it, click on the control -> then in the Data section, click on Add a parameter -> Put “Metric” under Parameter name -> In Permitted values, select “List of values” -> Assign 4 values: Impressions, Clicks, CTR and Average Position -> Click on Save and then Done.
Under the Data section, click on Add a field -> Put “Selected Metric” under Field name -> Insert this formula:
CASE Metric
WHEN "Impressions" THEN Impressions
WHEN "Clicks" THEN Clicks
WHEN "CTR" THEN Site CTR*100
WHEN "Average Position" THEN Average Position
END
Click on Save and Done.
Once you’re done with this, select the line chart -> Under Metric, change clicks to Selected Metric.
Step 2.2: Keyword Distribution Report – SERP Performance
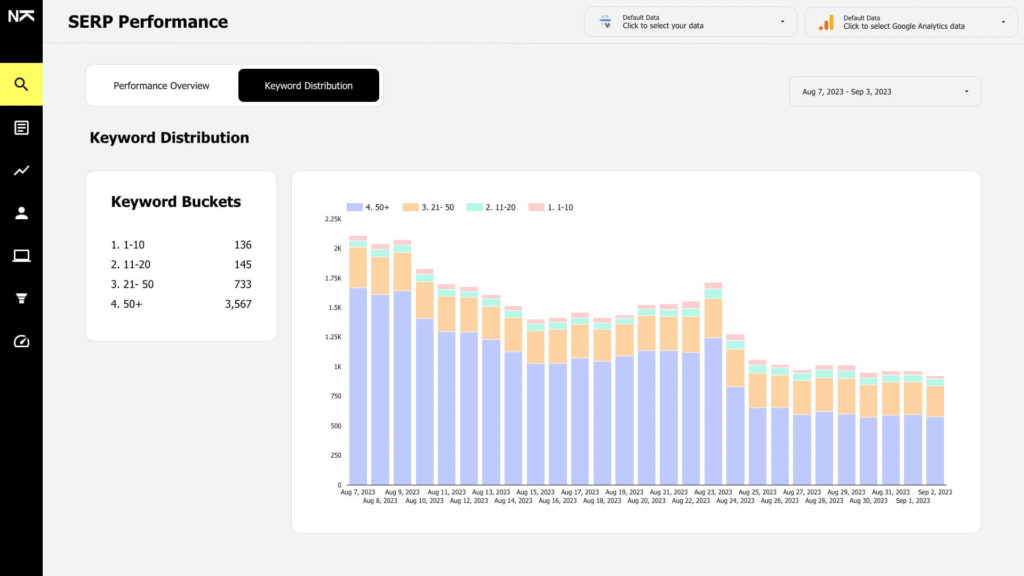
The keyword distribution report should start showing data automatically if you have configured data sources properly but if it doesn’t you’ll have to change some settings.
Go to Resource -> Manage Blends -> Edit Keyword Distribution Blend -> Remove any invalid dimensions from the Tables and add Average Position, Impressions and Clicks under Metrics in Table 1. In table 2, drag date under dimensions and click on Save.
Click on the left Keyword Buckets chart, remove any existing fields under dimensions, click on the Add dimension button -> Click on create field, name the field Keyword Buckets and add the following formula:
CASE
WHEN Average Position <= 10 THEN "1. 1-10"
WHEN Average Position > 10 AND Average Position <=20 THEN "2. 11-20"
WHEN Average Position > 20 AND Average Position <= 50 THEN "3. 21- 50"
ELSE "4. 50+"
END
Save the field. Then under metric, make sure you have Query as CTD.
For sort, use the Keyword Bucket Field that you just created.
Then click on the chart on the right and make sure you have the following setup:
Dimension – Date
Breakdown Dimension – Use the same keyword bucket formula in the new field.
Metric – Query as CTD.
Sort – Date as ascending
Secondary Sort – Keyword Buckets Field in Descending order.
Step 2.3: Top Content Report – Content Performance
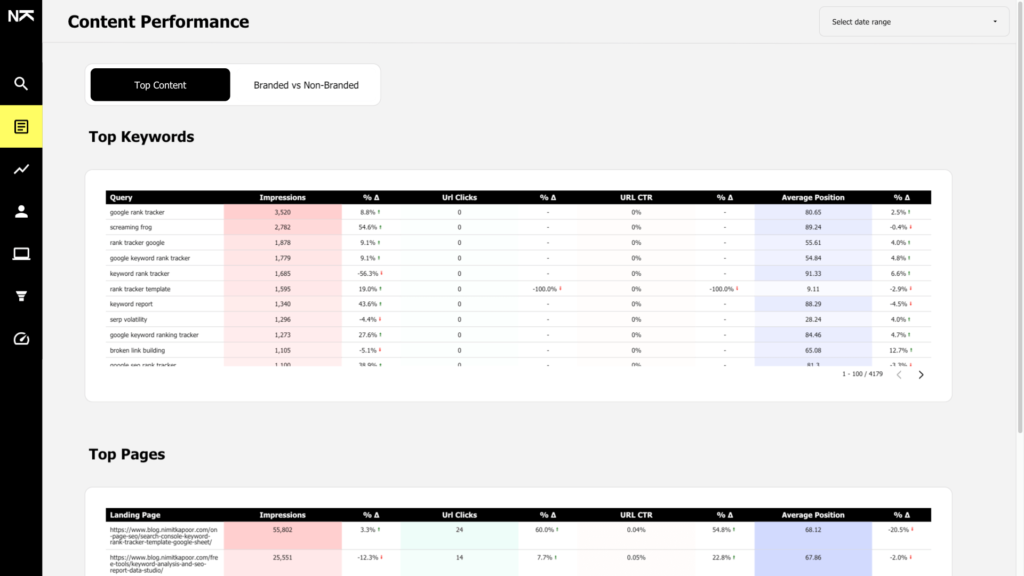
This section should start showing data automatically and would not require any additional setup. You can click on column titles to sort the report based on impressions, clicks, CTR or average position.
Step 2.4: Branded vs Non-Branded Report – Content Performance
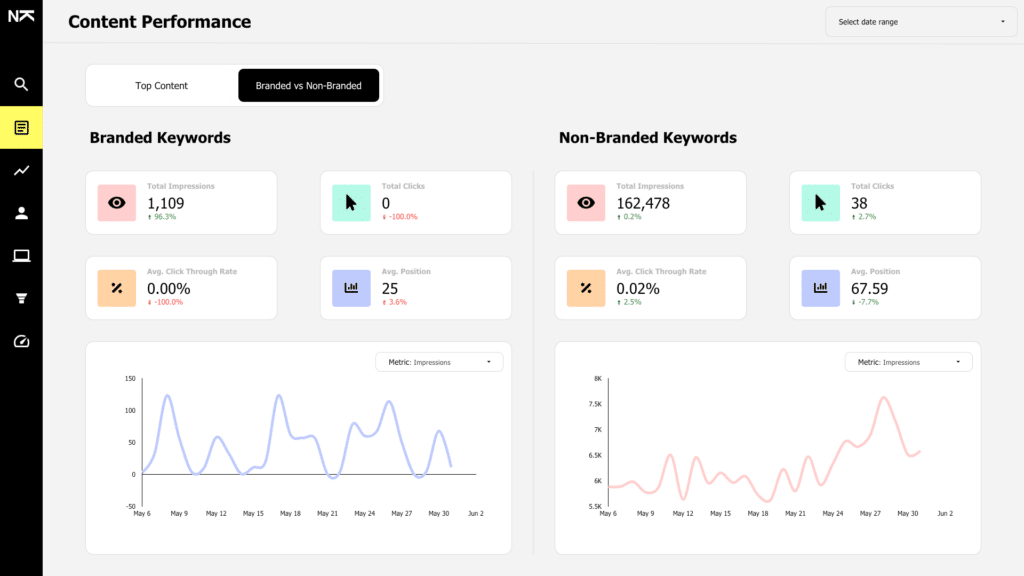
For this report, you’ll have to create a custom field in the search console data source.
Click on Add a Field -> Name the field “Branded vs Non-Branded Keywords” and insert the following formula:
CASE
  WHEN REGEXP_MATCH(Query,".*(brandname|brand1|brand2).*") THEN "Brand"
  ELSE "Non Brand"
END
Make sure to replace brandname, brand1, brand2 with different variations of your brand name.
Select each of the reports and change the data source to the search console source where you have created this field.
For the first chart in Branded and Non-Branded Keywords, you will have to fix the Filter and just select the field that you just created.
For the line chart, change the metric to “Selected Metric”.
Step 2.5: Google Algorithm Updates & Custom Events – SEO Reports
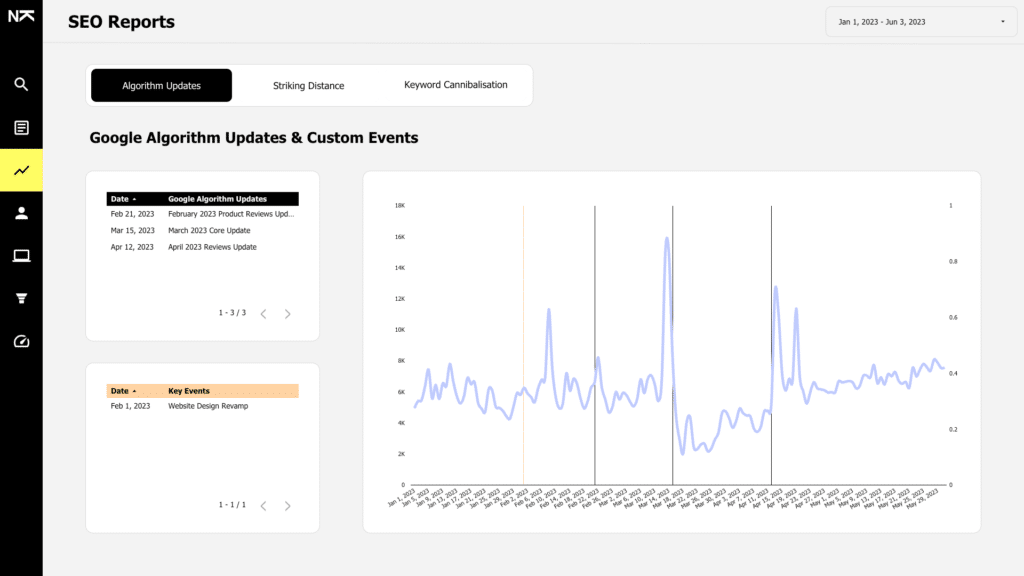
To set up this section of the Data Studio SEO Report, go to Resources in the top Navigation -> Click on Manage Blends -> Edit the Algo Updates & Custom Annotations Blend -> Remove the Invalid dimension from the Search Console table -> Replace Invalid Dimensions in Table 2 and 3 with Events and Updates -> Click on Save.
Select the charts that don’t update automatically and fix the Metric values as shown in the video below.
💡 You can update the Google Sheet with any new Google Algorithm Updates in the Updates Tab and with any custom events, like website redesign, hiring a new SEO agency etc in the Custom Events tab.
Doing so will automatically update the Data Studio Report.
If it doesn’t happen immediately, go to Data Studio, click on the three dots on the top right and click on “Refresh Data”.
Step 2.6: Striking Distance Report – SEO Reports
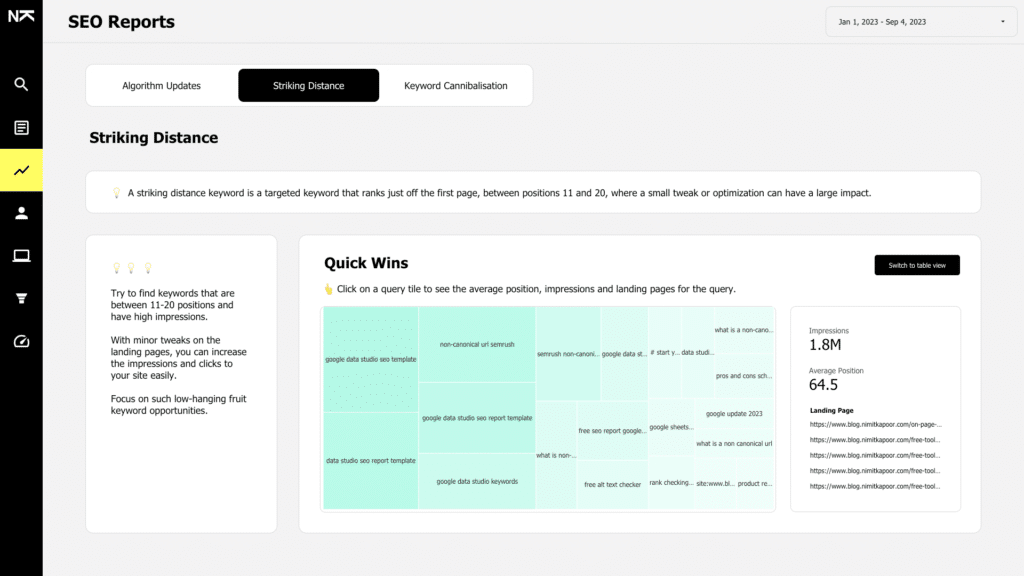
This report should start showing data automatically.
Step 2.7: Keyword Cannibalisation Report – SEO Reports
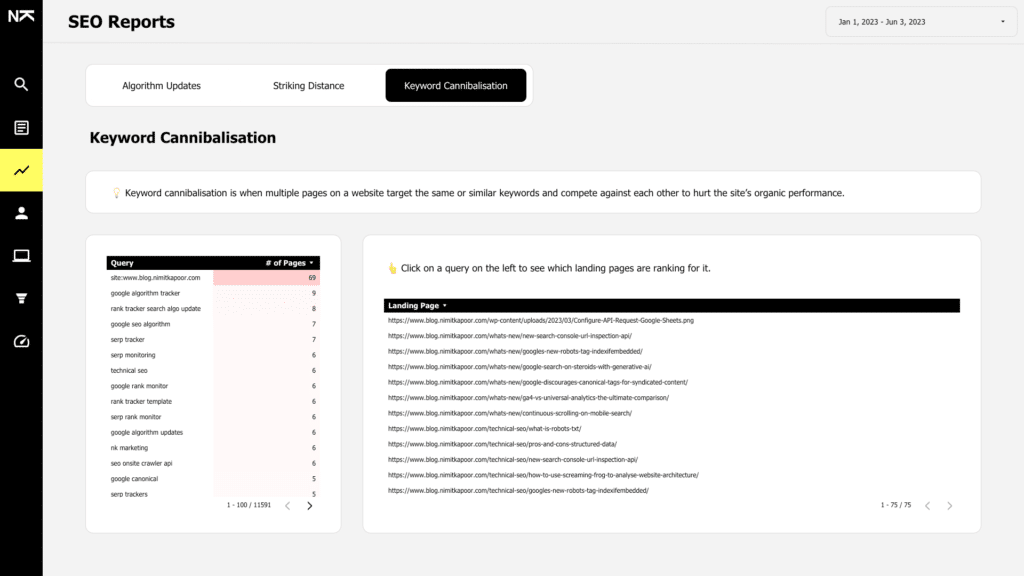
No additional setup is needed for this report. It’ll start working as soon as you connect the data sources while making a copy of this Data Studio SEO Report.
Step 2.8: Site Engagement Report
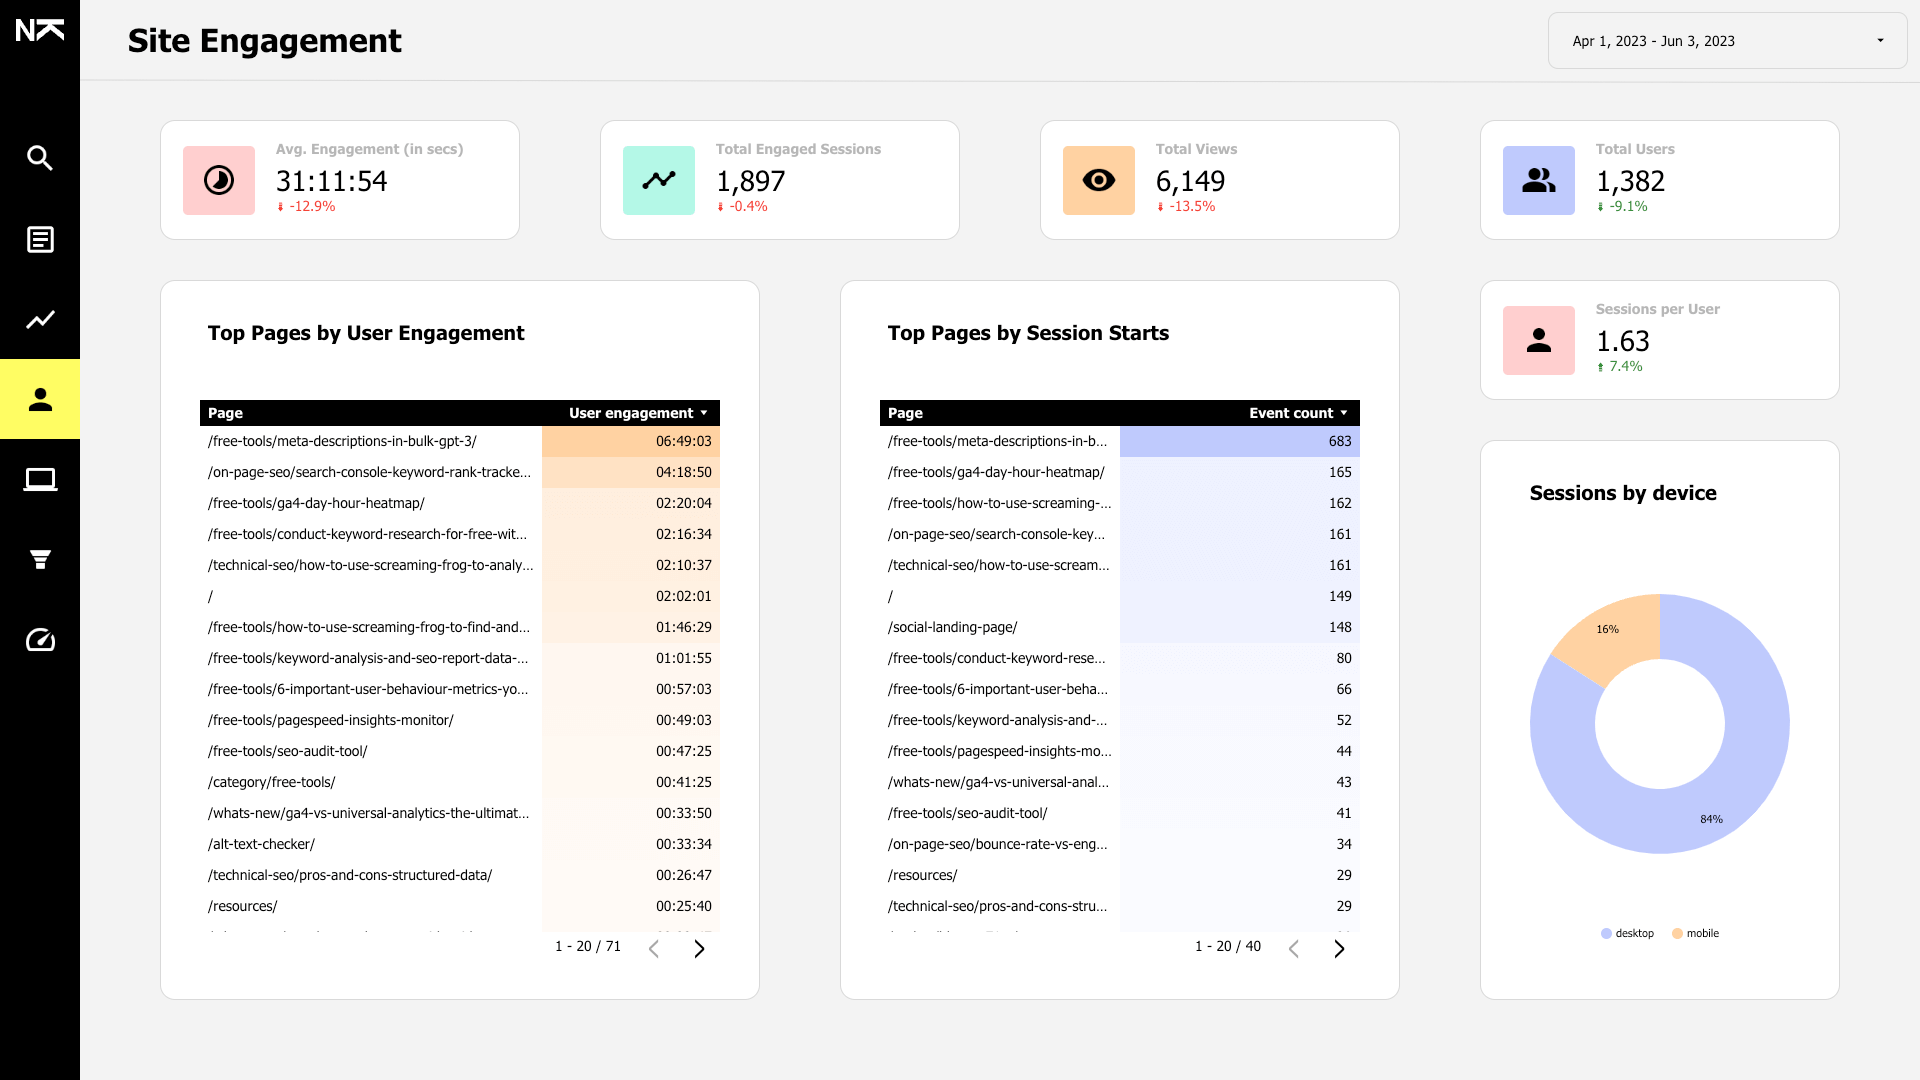
No additional setup is required.
Step 2.9: Traffic Acquisition & Growth Report
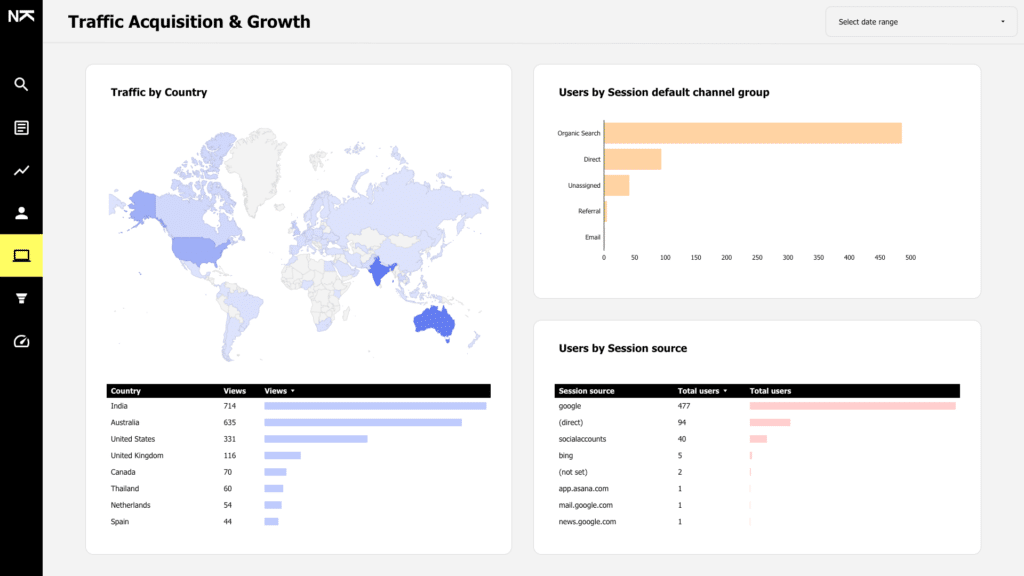
No additional setup is required.
Step 2.10: Conversion Report
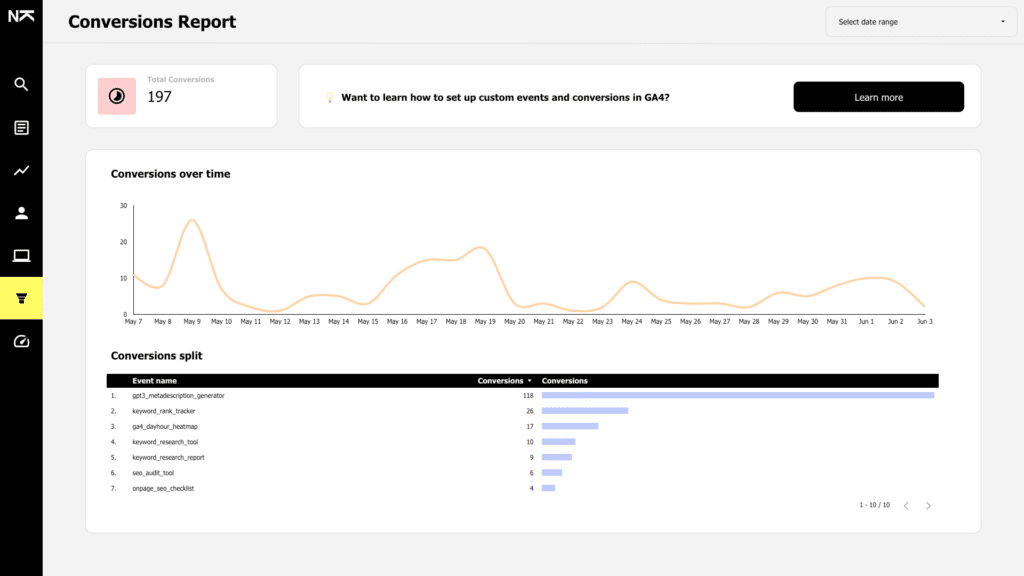
This report uses the conversions from GA4. If you haven’t set up conversions in GA4, this report would not show any data.
💡 It’s super important to set up conversions in GA4 because that’s how you can track the results of your marketing efforts. If you want to learn how to record custom events like button clicks, newsletter subscriptions, downloads, and more as events and conversions in GA4, you should definitely check out my blog post called “Track custom events in Google Analytics 4” Trust me, it’s a breeze to do with Google Tag Manager.
Step 2.11: PageSpeed Report
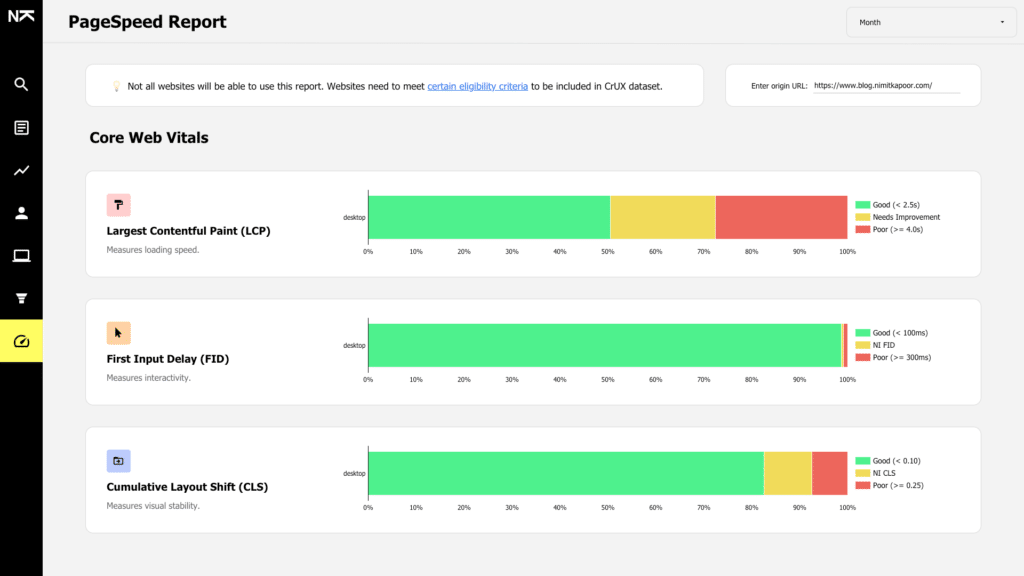
This report will only be available for domains that are included in the CrUX dataset. Your website needs to meet certain eligibility criteria to get included in this dataset. If your website has not been added yet, feel free to delete this section from the Google Data Studio SEO template.
If you’re seeing data, there’s just one thing that you need to fix. Just click on the chart on the top right and replace the metric with “origin”.
Final Thoughts
I hope you find this tool super helpful! Feel free to use it for your own clients too. Let me know in the comments if you found this SEO Report template useful or have any other ideas on how we can make it even better. Your feedback is much appreciated!

4 Responses
Massive thanks Nimit for this stunning report, your work is really appreciated ❤️
Thanks a lot Mark!
Hey Nimit! I just impleneted this for our team. I LOVE it. I have replaced our GA4 reports with it completely!! I also thanked you on LinkedIn to get a few more eyes on this awesome template. Truly, well done!
https://www.linkedin.com/posts/mark-byrne-uk_business-data-digital-activity-7080543388336304128-dATc?utm_source=share&utm_medium=member_desktop
What a goldmine!