It’s always good to analyse when the users are using your website and if there are any patterns that can prove to be useful.
The best way to present this information is through a heatmap. So I’ve created a Google Sheets, which will allow you to visualise certain metrics like Views, Sessions, Conversions etc by Day & Hour.
Here’s how it looks:
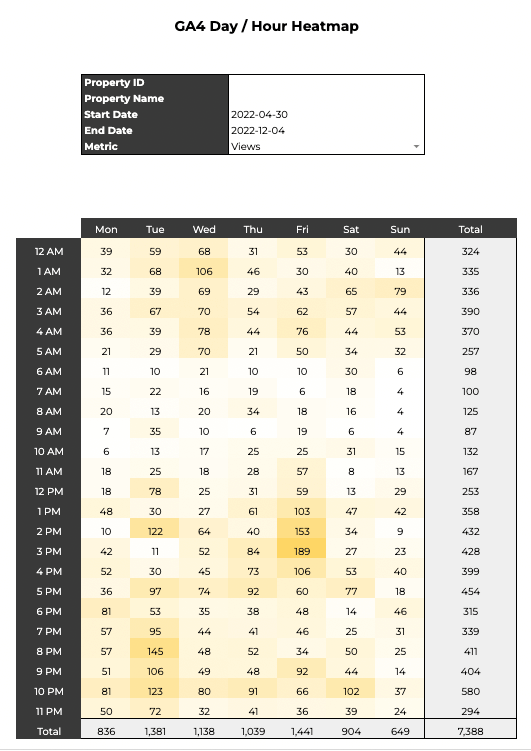
💡 The idea for this came from Seer’s blog post. They had created a heatmap for Universal Analytics. I just made an updated version for GA4 properties. So if you’re still using Universal Analytics, you can use their Google Sheet.
Why should you use this GA4 Day/Hour Heatmap?
Before we move on to the setup, lets look at few use cases:
- Understand when your site is getting the most views and sessions, so you can identify the best time to publish your new content.
- When does your website gets the most conversions. Note that conversions can be any user actions that are valuable for your business. For example: Newsletter sign ups, Purchases etc. You can see how to set up conversions on GA4 documentation.
- You might want to find what time of the day users are making the most purchases on your website, so that you can run some promotions to increase your revenue.
You can also track things like Checkouts and identify gaps. For instance, you may be getting less Checkouts after 7pm. It can be because your live chat is only available within business hours and people are not able to clarify their doubts. Looking at the checkout numbers, you can see whether implementing a 24/7 chat is worth it.
There can be plenty of other use cases for this GA4 Day/Hour Heatmap. If you can think of any other ones, it would be great if you can share it with others by commenting your thoughts below this post.
Setting up the Google Sheet:
Step 1: Make a copy of the GA4 Day/Hour Heatmap Google Sheet.
You can make a copy of this sheet by clicking here.
Step 2: Download the Reporting for Google Analytics 4 Add-on
To do this, go to Extensions -> Add-Ons -> Get Add-On.
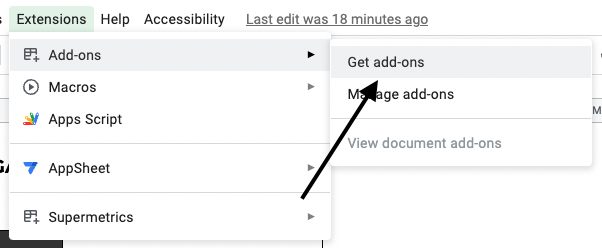
In the Search Bar type Reporting for Google Analytics 4 and install the Add-On from Adformatic.

Step 3: Get your GA4 Property Name and Property ID
To find your Property Name and Property ID, go to Google Analytics (GA4) -> Go to Admin -> Click on Property Settings to get your Property Name and Property ID.
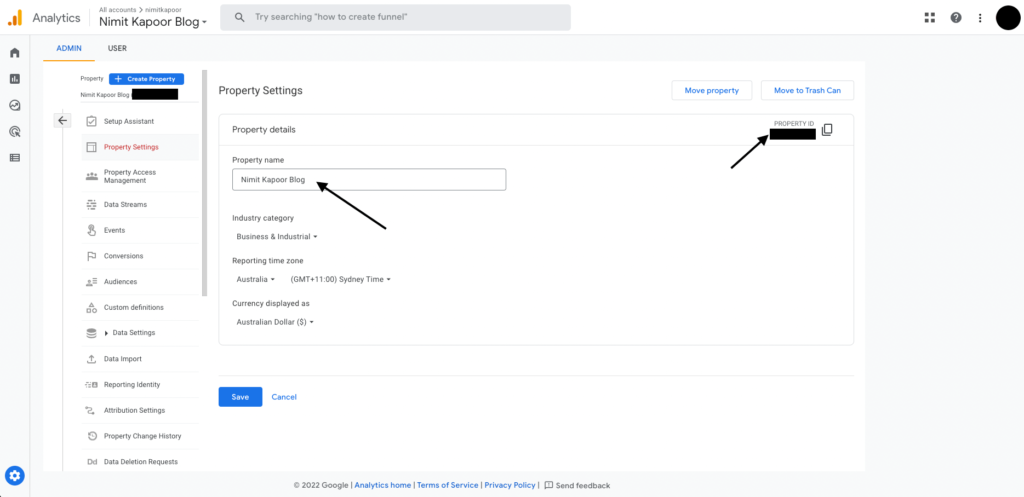
Once, you’ve got both the things, put it in the relevant section in the Heatmap sheet.

Step 4: Run the report
You can change the Start Date, End date and the Metric that you want the heatmap for before running the report. Please note the Start and End Date will be in yyyy-mm-dd format.
Once you’ve made your selections, Go to Extensions -> Reporting for Google Analytics 4 -> Run Reports.
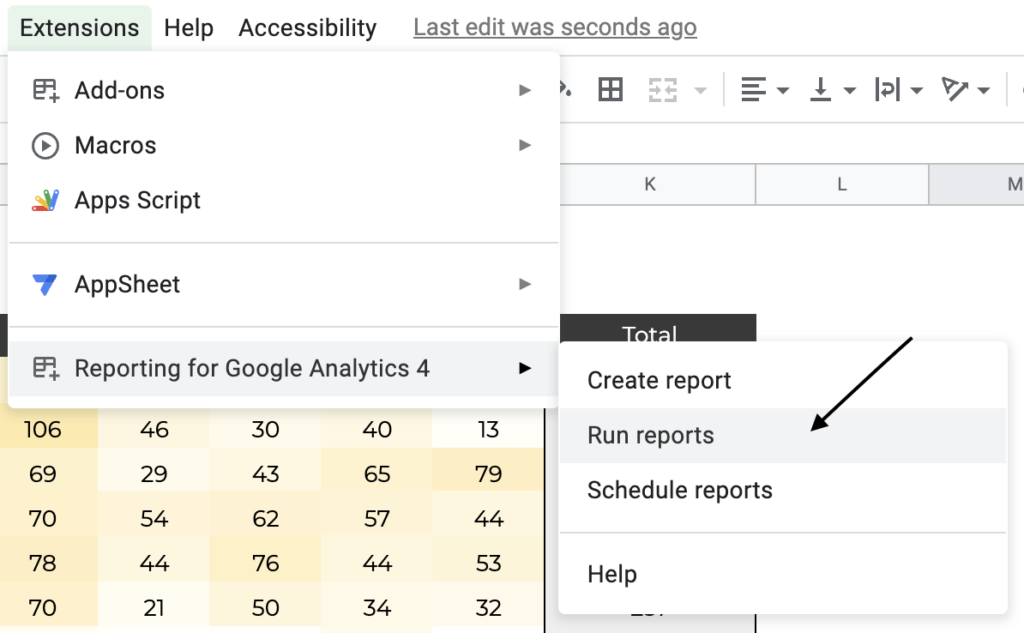
Your report will run and the heatmap will update with the Metric numbers. You can change the date range and Metric and Run the report again to refresh the Heatmap.
❗️If your heatmap doesn’t update or is blank even after running the report, just refresh the page and it should start working.

11 Responses
What time zone are the times based off? That would be helpful to visually see. Also, on the pivot table for days of the week, is 0 considered Sunday? Thanks for building this!
Hey Nooner,
Thanks a lot! I’m glad you found it helpful.
Here are the answer to your questions:
1. The API returns the timezone of your property in GA4. To check the timezone of your property, you can go to GA4 > Admin Settings > Property Settings and you’ll see the timezone of your property there. So depending on the timezone of your property, the report will adjust to it.
2. Yes, you’re correct, the pivot table considers 0 as Sunday. If you want to further explore the response you can visit the GA4 API Documentation: https://developers.google.com/analytics/devguides/reporting/data/v1/exploration-api-schema
Check the description of *dayOfWeek* dimension.
I hope this answers your question.
Thank you for this resource Nimit! Worked great and helped with showing metrics I couldn’t find native in GA4.
Hi. This is great. I am running Sessions as the Metric and for 12pm on the Heatmap the sessions looks very low (6,870 total) seen here: https://www.screencast.com/t/5I4kLtoi24P but on the Pivot Table (Sum of Sessions), for the 12 Hour it shows 27,038 which makes more sense. https://www.screencast.com/t/nFMP3RyaX Any clue what is happening in the heat map? Thanks
Hi. This is an update to a comment I tried to make yesterday and I am not sure if you received it. This is great. I am running Sessions as the Metric and for 12pm on the Heatmap the sessions looks very low (6,870 total) seen here: https://www.screencast.com/t/5I4kLtoi24P but on the Pivot Table (Sum of Sessions), for the 12 Hour it shows 27,038 which makes more sense. https://www.screencast.com/t/nFMP3RyaX Any clue what is happening in the heat map? I do see that Tuesday for 12pm shows it is referencing D15 on the Pivot Table, but D15 is Tuesday at 2 (2am). https://www.screencast.com/t/Sk9u18fE How do do make sure the pivot table is correctly matching the hours for the Heatmap?
Hey Erik,
I noticed in your screenshot that the first column of your pivot table is a bit jumbled up for some reason. This is why the Heatmap is picking up the wrong values. Ideally, the order should be from 0 to 23 in ascending order, just like: https://imgur.com/a/s3ko8w1. However, it seems you have the numbers starting from 1 first, and then the numbers starting from 2. It might be a good idea to check if there’s any specific sorting applied to that column.
I looked into that too, and there is no special sorting on that column. I just made fresh copy of your file from the above link, entered our info and choose Sessions, and ran the report. It did the same thing. There is something with that data sorting after the report runs. So how do I fix it? I am not sure how to fix the sorting with the row 1 title there (SUM of Session. Day of Week) and if I need to select all cells and then sort by column A (Hour). Thoughts?
I think it has something to do with your data coming in as Text and not a Number format. I tried changing the Hour column to Number and it did not help. Ascending still does 0,1,10,11,12,13,14,15,16,17,18,19,2,20… Ideas? I found this on https://stackoverflow.com/questions/69937795/advance-range-sorting-options-not-sorting-in-order-for-numbers but it did not help.
Hey Erik,
I found an easier solution to this mate! You’re right about the fact that it’s because the data is being treated text and not numbers. Easiest is to give the range in the “Test” sheet this format “#,##0” – this fixes the order in the pivot table automatically resulting in correct numbers being picked up in the Heatmap.
Here’s a screen recording: https://imgur.com/a/qh9VGJt
Thanks a lot for bringing this to my attention.
Thanks! I am surprised the Test sheet fixes the pivot tab automatically.
How do we change the colors for the Heatmap?