
You’ve done your research, produced some extremely compelling pieces of content and published them on your website. You’ve also ticked everything off on the On-Page SEO Analysis Checklist and have started working on Off-Page Optimisation Strategy. Now what?
Now it’s time to define your Key Performance Indicators and start measuring them. Any successful strategy – Content, SEO or Social Media has clearly defined metrics that tell the marketers whether the strategy is achieving its desired purpose.
It’s extremely crucial to focus on and track the right metrics. For different objectives, you’ll have different metrics that need to be focused on. For instance, if your objective is to improve engagement, you’ll be looking at metrics such as likes, shares, comments, brand mentions etc.
In this article, we will be focusing on tracking the User Behaviour metrics.
What is User Behaviour?
User Behaviour simply refers to all the actions that a visitor takes on the website: where they click, how much time they spend on a page, which page do they exit from and so on.
It’s extremely important to track User Behaviour metrics as it can give you some extremely valuable insights. With User Behaviour analytics, you can:
- Analyze what your visitors are interested in.
- Identify the points in customer journey where the visitors get stuck or confused.
- Investigate how specific pages or pieces of content are performing.
User Behaviour Metrics that you can track
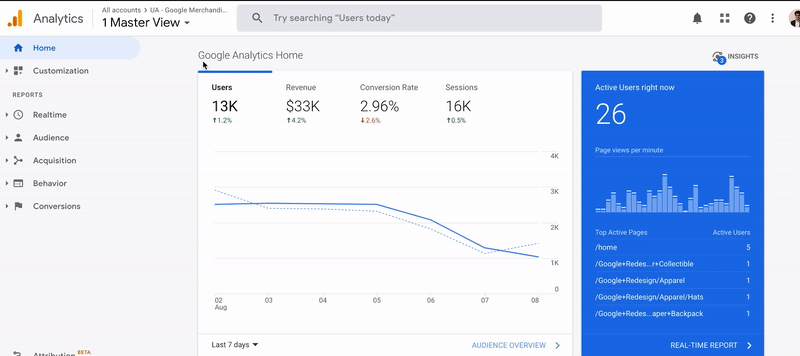
For the purpose of this blog post, we will be using the free Google Analytics tool and the Demo Analytics Account of Google Merchandise Store. You can access the demo account by clicking here. Once you have gone through the list below, you can install the Google Analytics Tracking code on your website and start measuring these metrics for your own website.
Once you access the demo account, it might open the UA Property by default. But we will be switching to the new GA4 Analytics View as GA4 will be eventually replacing the original Universal Analytics (UA).
This is how you can change the view and start measuring your User Behaviour Metrics:
Now lets get straight to the point and see which metrics you should analyse:
1. Pageviews
Pageviews simply show the number of times a page on your website has been visited. It helps you understand which page or topic on your website attracts the most attention. By analysing the Pageviews, you can get an idea of what type of content your audience wants to consume.
Note: It’s easy to get confused between Pageviews and Unique Pageviews. Under Unique Pageviews a user can refresh the page multiple times, or visit some other page and then come back to the original page but if all of this was done in one single session, it’ll be counted as one unique pageview.
Under Pageviews, if a user refreshes the page or comes back to the original page after visiting some other page on the website, it’ll be counted as a separate pageview.
GA4: To see the Views (page_views in GA4), head to Life Cycle -> Engagement -> Engagement Overview -> Scroll down to see the number of views.

2. Users (New and Returning)
Users refer to the total number of active users on your website. This helps you determine the scope of your document.
New Users refer to those users who have visited your website or opened your app for the first time. This type of interaction triggers the first_open event. New visitors show how big is the pool of potential leads for your business.
Returning Users in Google Analytics 4 are users that have already visited your website or app in a predetermined timeframe. They have initiated another session in the same browser and the same device before. This number tells you how much the users enjoy the content on your website.
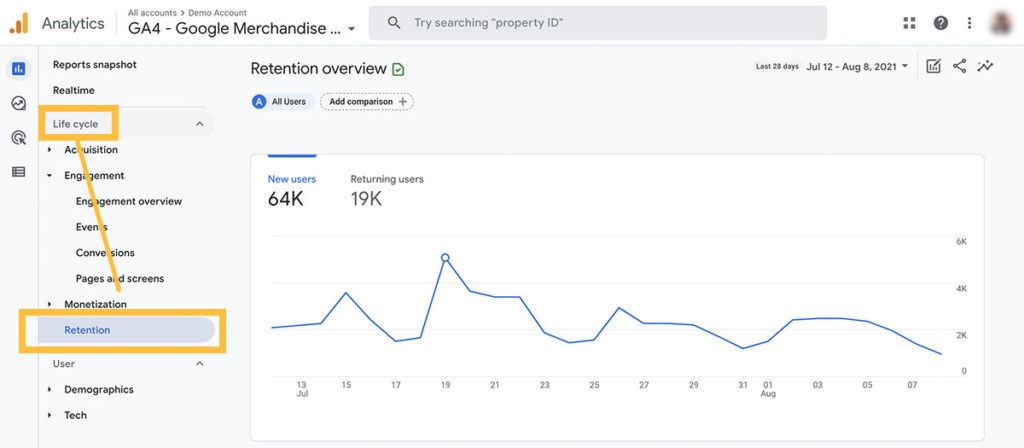
GA4: To see New and Returning Users, head to Lifecycle -> Retention. You’ll see the following screen where the number of new and returning users will be listed for the time period that you’ve set.
3. Average Time on Page
Average Time on Page (or Average Engagement Time in GA4) refers to the amount of time that the website was in focus in the browser. This tells you whether your website visitors are actively reading the content or just skimming through it.
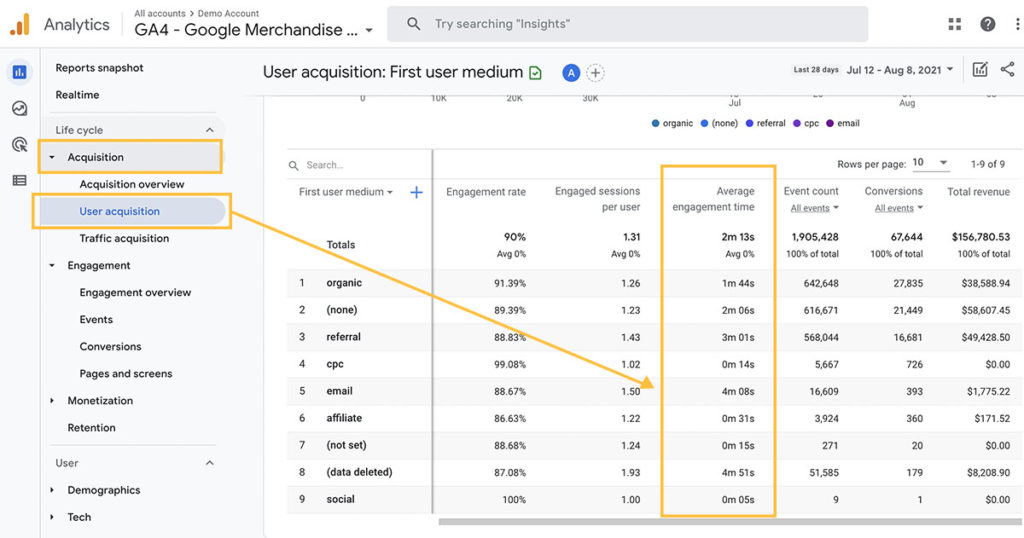
GA4: To see average engagement time in GA4, click on Life Cycle -> Acquisition -> User Acquisition. You’ll find average engagement time in the table below the graphs. This will give you the average engagement time of users that come to the website from different sources, such as, organic search, cpc etc.
If you want to see the average engagement time for the pages on your website, you can head to Pages and Screens under Engagement instead of clicking on Acquisition.
4. Bounce Rate
Bounce Rate is a single-page session on your site. Or when a user visits your website but does not trigger any other request to the Analytics server. This is a metric that is widely used to find out pages where the user experience is ideal and from which page the visitor is existing the website.
This metric has quite a lot of limitations and to overcome some of these, GA4 now reports engagement rates instead of bounce rates.
Engagement rate refers to engaged sessions divided by the total number of sessions.
What are engaged sessions?
An engaged session is one where the user:
- Spends 10 seconds or more on the page, or
- Viewed 2 or more screens/pages or
- Had a conversion event.
To find out the engagement rates, you can head to Life Cycle -> Acquisition -> User Acquisition. You’ll find the engagement rate values in the table.

To learn more, read this post that talks specifically about the difference between Bounce Rate and Engagement Rate and which metric is better.
5. Pages per Session
If you’ve ever come across a website analytics report, you must have heard of this metric. Pages per session simply indicates the average number of pages measured per session. This shows if the content on your website is interesting enough to make the user explore other content on your website.
If you’re shifting to GA4 from Universal analytics, which you’ll have to sooner or later, you’re up for a surprise.
GA4 does not report this metric as a default? And it has good reason for it.
People today have browser tabs open almost all the time. They open tabs and without engaging with the content go about doing something else only to come back to it later and engaging with it.
In Universal Analytics (UA), if the user doesn’t click to other page, it is considered that the time spent on the page is zero. GA4 addressed this issue by measuring a variety of different metrics such as, time spent on page, page scroll, clicks etc.
Everything considered, it is still a good metric to include in your analysis and you can calculate it dividing the total page views for a time period to the total sessions for that period.
Note: This number might be different from the one reported by Universal Analytics due to the different calculations of sessions.
6. Traffic Sources
This metric shows where your website visitors are coming from. This marketing metric can help you determine which channels are the most and the least effective in terms of driving traffic to your website.
You can use this data to allocate your time and effort to these marketing channels. Two good metrics to see in combination to Traffic Sources are revenue from each channel and the conversion rates. You’ll then have a good idea of your Return on Investment.
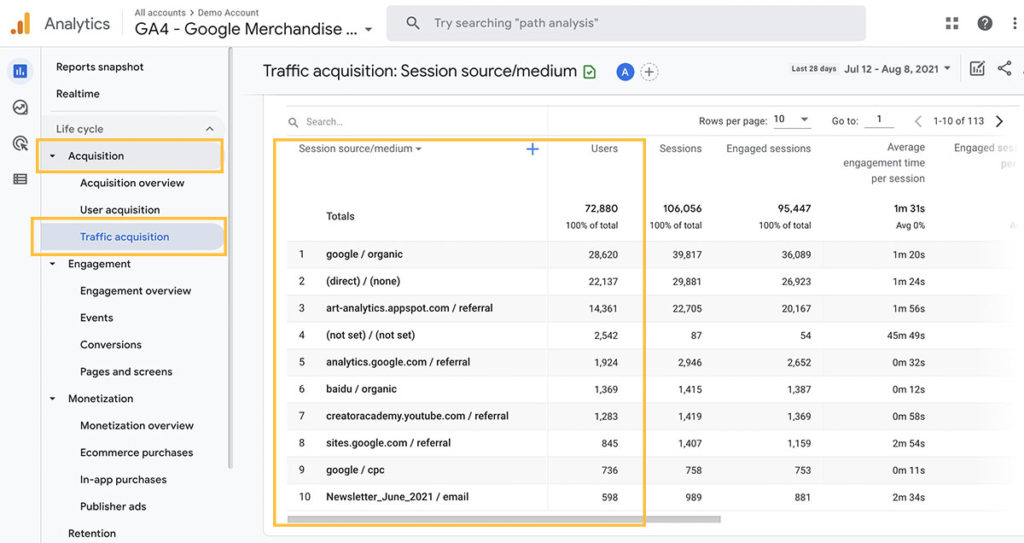
To check traffic sources that are driving visitors to your website, head to Life Cycle -> Acquisition -> Traffic Acquisition.
Using data analytics to identify problem areas, such as, your website’s content and architecture, choice of marketing channels etc and improve them is the secret to success.
It’s extremely important to select the right metrics to track. This selection should also take the funnel stage of the visitor into consideration. Apart from user behaviour, you should also constantly track your SEO performance using metrics, such as, Backlinks, Dwell Time, Keyword Rankings and Organic Traffic.
